Master Backtracking: From Basics to Advanced for SDEs
1st Nov, Sat
06:25 PM - 12:53 PM
2250 registered
ISO-certified
AI Powered
Transform raw data into powerful business insights with comprehensive Data Analytics Certification Training. This intensive program combines statistical analysis, advanced Excel, SQL databases, Python programming, and cutting-edge visualization tools like Power BI and Tableau to prepare you for high-demand analytics roles.
150k+ Placemenets to Date
600+ Hiring Partners
76 Lakhs Highest Annual
Next Batch starts in November


Build an Impressive Portfolio
Expand Your Career Opportunities
Stay Ahead with Industry Trends
Master Cutting-Edge Development Tools
Data analysts are critical assets across every sector—from technology giants and financial institutions to healthcare, retail, and consulting firms. Our graduates secure analytics positions at leading organizations leveraging data-driven strategies for competitive advantage and innovation.

₹4–10 LPA (Entry-Level), ₹10–18 LPA (Mid-Level), ₹18–25 LPA (Senior-Level)

Data Analysts collect, organize, and analyze data to generate actionable insights and support decision-making processes.
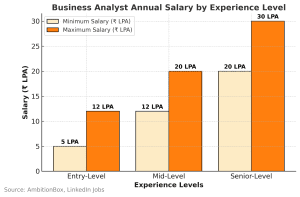
₹5–12 LPA (Entry-Level), ₹12–20 LPA (Mid-Level), ₹20+ LPA (Senior-Level)

Business Analysts identify business needs and create data-driven solutions to improve efficiency and performance.

₹8–16 LPA (Entry-Level), ₹18–30 LPA (Mid-Level)

Analytics Consultants work closely with clients to provide tailored data-driven solutions and strategies for business challenges.

₹4–8 LPA (Entry-Level), ₹8–15 LPA (Mid-Level)

Marketing Analysts use data to evaluate marketing campaigns, identify trends, and optimize strategies for better ROI.

₹5–10 LPA (Entry-Level), ₹12–20 LPA (Mid-Level)

Financial Analysts use data analytics to study market trends, forecast revenues, and support investment decisions.
₹5–10 LPA (Entry-Level), ₹10–18 LPA (Mid-Level)

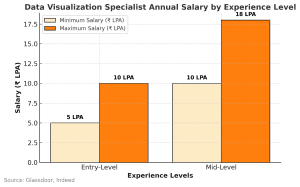
Data Visualization Specialists create compelling charts, graphs, and dashboards using tools like Power BI, Tableau, and Python libraries.
Data analysts are critical assets across every sector—from technology giants and financial institutions to healthcare, retail, and consulting firms. Our graduates secure analytics positions at leading organizations leveraging data-driven strategies for competitive advantage and innovation.
₹4–10 LPA (Entry-Level), ₹10–18 LPA (Mid-Level), ₹18–25 LPA (Senior-Level)
Data Analysts collect, organize, and analyze data to generate actionable insights and support decision-making processes.
₹5–12 LPA (Entry-Level), ₹12–20 LPA (Mid-Level), ₹20+ LPA (Senior-Level)
Business Analysts identify business needs and create data-driven solutions to improve efficiency and performance.
₹8–16 LPA (Entry-Level), ₹18–30 LPA (Mid-Level)
Analytics Consultants work closely with clients to provide tailored data-driven solutions and strategies for business challenges.
₹4–8 LPA (Entry-Level), ₹8–15 LPA (Mid-Level)
Marketing Analysts use data to evaluate marketing campaigns, identify trends, and optimize strategies for better ROI.
₹5–10 LPA (Entry-Level), ₹12–20 LPA (Mid-Level)
Financial Analysts use data analytics to study market trends, forecast revenues, and support investment decisions.
₹5–10 LPA (Entry-Level), ₹10–18 LPA (Mid-Level)
Data Visualization Specialists create compelling charts, graphs, and dashboards using tools like Power BI, Tableau, and Python libraries.
This comprehensive curriculum spans statistical foundations, database management, business intelligence tools, and Python programming for analytics. Progress from descriptive statistics and hypothesis testing through advanced Excel analytics, SQL queries, Power BI dashboards, Tableau visualizations, and Python-based data manipulation — culminating in real-world predictive modeling and automation projects.
Prerequisites: Basic knowledge of Excel and statistics is recommended. Interest in data analysis, business intelligence, and problem-solving will help you grasp advanced analytics efficiently.
Learn data collection, cleaning, visualization, SQL queries, Python/R analysis, and Power BI dashboard creation with practical examples from real-world datasets.
Advantages & Disadvantages of Visualizations
Why Data Visualization is Important
Understanding Data
Different Types of Data Visualizations
What is Tableau?
Overview of Tableau Tool (Servers, Data, Visualizations)
Basic Charts
Text Tables
Highlight Tables
Bar Charts
Stacked Bar
Line Graphs
Dual Axis
Pie Charts, etc.
VLOOKUP & its Limitations
HLOOKUP
INDEX-MATCH
HYPERLINK
INDIRECT
OFFSET
TRANSPOSE
General VLOOKUP Problems
VLOOKUP with MATCH Function
VLOOKUP using (*) Problems
VLOOKUP using Running COUNTIF
Nested VLOOKUP
CHAR
CONCATENATE
EXACT
FIND
LEFT / RIGHT
PROPER
SEARCH
MID
UPPER
AND
IF
IFERROR
NOT
OR
TRUE
DAY
DATE
HOUR
MINUTE
SECOND
TIME
MONTH
YEAR
TODAY
WEEKDAY
NOW
SUM
SUMIF / SUMIFS
COUNT / COUNTIF
MOD
PRODUCT
SUMPRODUCT
ROUNDUP
ARRAY FORMULAS
Pivot Tables & Pivot Charts
Waterfall Mode
Create, Drop, Truncate, Alter, and Rename Objects
Select Statements
Grant, Revoke, and Transaction Statements
Numeric
Date and Time
LOB Types
Insert, Update, and Delete Statements
Create and Drop Databases
Examples
Start, Commit, and Rollback Statements
Identifier
Rollback and Release
Creating, Altering, and Dropping Tables
Advantages
Creating and Dropping Views
Types of Stored Objects
Inner Join
Left Join
Right Join
Deque in Python
Python Dict
Python Tuples
Python Frozenset
Difference between List, Tuple, Dict, Set, and FrozenSet
List Comprehensions
Set Comprehensions
Dictionary Comprehensions
Set Comprehensions
Apply your skills through comprehensive projects including customer segmentation analysis, sales forecasting dashboards, financial risk assessment models, marketing campaign optimization, supply chain analytics, and predictive modeling using Python—all based on authentic business scenarios and datasets.
Skills: Data Cleaning, Data Visualization, Business Intelligence, Excel Functions, KPIsTools: Microsoft Excel, Power BI, Tableau, SQL Description:Students will look at a company's sales data and make a performance dashboard that shows trends in revenue, best-selling products, customer groups, and sales by region. The project starts with cleaning up data, making…
Skills: Predictive Analytics, Machine Learning Basics, Data Wrangling, VisualizationTools: Python (Scikit-learn, Pandas, Matplotlib), Power BI, Tableau, Excel Description:Keeping employees is very important to businesses. Students will look at HR datasets in this project to find patterns that explain why employees leave. They will use Python to clean the data, do…
Skills: Data Preprocessing, Exploratory Data Analysis (EDA), Clustering, Data StorytellingTools: Python (Pandas, NumPy, Matplotlib, Seaborn), Jupyter Notebook, SQL, Excel Description:To grow your e-commerce business, you need to know how customers act. Students will use real-world e-commerce data to do segmentation and behavior analysis for this project. They will clean up…
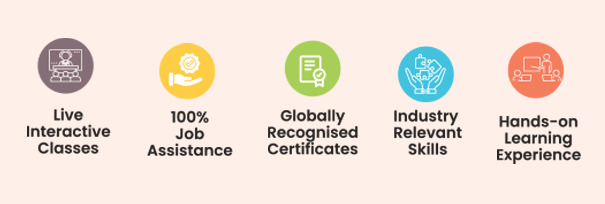
Receive a globally valued certification that validates your skills, practical knowledge, and job-ready expertise. This certification enhances your credibility, strengthens your resume, and helps you stand out to employers in competitive industries worldwide.
Professionals Trained
Countries & Counting
Corporate Served


The demand for skilled data science professionals is skyrocketing as industries leverage data to gain strategic insights and optimize operations. Frompredictive analytics to AI-powered solutions, data science is transforming business.
Master a curriculum crafted and constantly updated by industry experts to match real-world trends, ensuring every concept and project builds job-ready, future-proof skills.
Receive one-on-one mentorship, resume reviews, mock interviews, and complete placement assistance through our 500+ hiring partners to accelerate your tech career.
Learn directly from certified professionals with years of hands-on experience who guide you through every module, project, and career milestone personally.
Gain practical exposure by working on live, industry-grade projects that mirror real business challenges, strengthening your technical execution and problem-solving abilities.
Join thousands of successful learners who have launched rewarding tech careers through Grras. Our consistent placement results, trusted partnerships, and alumni success stories speak for the quality of our training.
Navigate your professional journey with a comprehensive guide that transforms learning into opportunity. Discover proven strategies to build skills, gain experience, and secure your ideal position in today’s competitive job market.
 Building Strong Foundation
Focus on industry-relevant skills

Real-world projects to implement learned concepts.

Weekly tests to assess progress

 Sharpening Interview Readiness
Mock sessions with real-time feedback from experts

Host industry experts for advanced technical guidance

Focus on problem-solving, critical thinking, and domain expertise

 Communication & Aptitude Skill Development
Through interactive classes, students enhance both verbal and non-verbal communication, while also learning to present their ideas clearly, confidently, and effectively.

Enhances students' problem-solving, analytical thinking, and numerical ability-preparing them for competitive exams and placement tests.
 Resume building masterclasses
Help students structure professional, impactful resumes

 Bridging the Gap
* Partner with top companies for hiring pipelines * Conduct webinars and sessions with recruiters
* Connect candidates to aligned opportunities * Organize hiring events and recruitment drives
 Advance interview boot camp
Equip students to handle high-pressure interview situations
Prepare students for various interview formats, including case studies, coding rounds, and group discussions
 Personalized 1:1 guidance
* Address specific weaknesses and barriers to success. * Develop personalized improvement plans

Focus on industry-relevant skills
Real-world projects to implement learned concepts.
Weekly tests to assess progress
Mock sessions with real-time feedback from experts
Host industry experts for advanced technical guidance
Focus on problem-solving, critical thinking, and domain expertise
Through interactive classes, students enhance both verbal and non-verbal communication, while also learning to present their ideas clearly, confidently, and effectively.
Enhances students' problem-solving, analytical thinking, and numerical ability-preparing them for competitive exams and placement tests.
Help students structure professional, impactful resumes
* Partner with top companies for hiring pipelines * Conduct webinars and sessions with recruiters
* Connect candidates to aligned opportunities * Organize hiring events and recruitment drives
Equip students to handle high-pressure interview situations
Prepare students for various interview formats, including case studies, coding rounds, and group discussions
* Address specific weaknesses and barriers to success. * Develop personalized improvement plans

Our extensive network of hiring partners spans various industries, offering diverse opportunities to kickstart your career.


Explore our top courses designed to build in-demand tech skills. Learn from expert trainers with practical training and industry-relevant curriculum.

Copyright © 2026 GRRAS Solutions Pvt. Ltd.