

AI for Everyone: Learn the Future
1st Jul, Mon
12:00 AM - 07:28 PM
1458 registered
ISO-certified
AI Powered


Explore the data analytics course in Jaipur at GRRAS, combining Excel, Google Sheets, SQL, BigQuery, Python, R, Power BI, Tableau and Looker Studio. The 6-month AI-Powered Data Analytics & Automation Master Program connects data cleaning, statistical analysis and business intelligence with Power Automate, prompt engineering, ChatGPT and Gemini. Practise dashboards, reporting workflows and predictive insights through business case studies. Review GRRAS Jaipur training options and the course FAQs, then confirm the current classroom or live online batch schedule with our advisor.
100% job assistance supports your career preparation and job search, without guaranteeing employment. Course fees are shared during counselling.

150k+ Placemenets till Date

600+ Hiring Partners

76 Lakhs Highest Annual Package




Build an Impressive Portfolio

Expand Your Career Opportunities

Stay Ahead with Industry Trends

Master Cutting-Edge Development Tools
Data analytics skills support work across finance, retail, marketing, healthcare and operations. Explore roles such as data analyst, BI analyst, reporting analyst and data visualisation specialist, and build a portfolio that demonstrates data preparation, SQL, dashboards and interpretation. Employment and salary depend on experience, demonstrated skills and employer requirements; completing training does not guarantee a job or package.
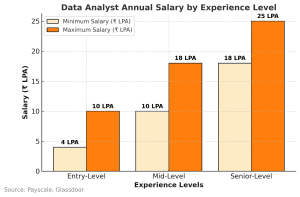
₹4–10 LPA (Entry-Level), ₹10–18 LPA (Mid-Level), ₹18–25 LPA (Senior-Level)

Data Analysts collect, organize, and analyze data to generate actionable insights and support decision-making processes.
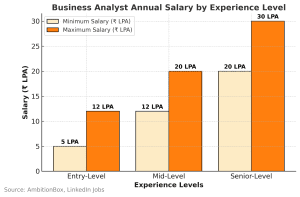
₹5–12 LPA (Entry-Level), ₹12–20 LPA (Mid-Level), ₹20+ LPA (Senior-Level)

Business Analysts identify business needs and create data-driven solutions to improve efficiency and performance.

₹8–16 LPA (Entry-Level), ₹18–30 LPA (Mid-Level)

Analytics Consultants work closely with clients to provide tailored data-driven solutions and strategies for business challenges.

₹4–8 LPA (Entry-Level), ₹8–15 LPA (Mid-Level)

Marketing Analysts use data to evaluate marketing campaigns, identify trends, and optimize strategies for better ROI.

₹5–10 LPA (Entry-Level), ₹12–20 LPA (Mid-Level)

Financial Analysts use data analytics to study market trends, forecast revenues, and support investment decisions.
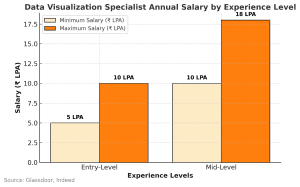
₹5–10 LPA (Entry-Level), ₹10–18 LPA (Mid-Level)

Data Visualization Specialists create compelling charts, graphs, and dashboards using tools like Power BI, Tableau, and Python libraries.
Data analytics skills support work across finance, retail, marketing, healthcare and operations. Explore roles such as data analyst, BI analyst, reporting analyst and data visualisation specialist, and build a portfolio that demonstrates data preparation, SQL, dashboards and interpretation. Employment and salary depend on experience, demonstrated skills and employer requirements; completing training does not guarantee a job or package.
₹4–10 LPA (Entry-Level), ₹10–18 LPA (Mid-Level), ₹18–25 LPA (Senior-Level)
Data Analysts collect, organize, and analyze data to generate actionable insights and support decision-making processes.
₹5–12 LPA (Entry-Level), ₹12–20 LPA (Mid-Level), ₹20+ LPA (Senior-Level)
Business Analysts identify business needs and create data-driven solutions to improve efficiency and performance.
₹8–16 LPA (Entry-Level), ₹18–30 LPA (Mid-Level)
Analytics Consultants work closely with clients to provide tailored data-driven solutions and strategies for business challenges.
₹4–8 LPA (Entry-Level), ₹8–15 LPA (Mid-Level)
Marketing Analysts use data to evaluate marketing campaigns, identify trends, and optimize strategies for better ROI.
₹5–10 LPA (Entry-Level), ₹12–20 LPA (Mid-Level)
Financial Analysts use data analytics to study market trends, forecast revenues, and support investment decisions.
₹5–10 LPA (Entry-Level), ₹10–18 LPA (Mid-Level)
Data Visualization Specialists create compelling charts, graphs, and dashboards using tools like Power BI, Tableau, and Python libraries.
 BigQuery
Business Intelligence
BigQuery
Business Intelligence
 Chat-GPT
Data Analyst Training
Chat-GPT
Data Analyst Training
 Data Analytics
 Course
Data Analytics Jaipur
Data Cleaning
Data Analytics
Data Analytics Course
Data Analytics Jaipur
Data Cleaning
 Data Visualization
 Excel
Exploratory Data Analysis
Excel
Exploratory Data Analysis
 Gemini
Generative AI
Gemini
Generative AI
 Google Sheets
 Looker Studio
 Matplotlib
 NumPy
NumPy
 Pandas
 Power Automate
 PowerBi
 Prompt Engineering
 Python
 R Programming
 R Studio
 Seaborn
 Sql
Sql
 Statistics
 Tableau
This upgraded analytics curriculum delivers a complete journey from foundational data concepts to advanced, AI-powered business intelligence. The program now integrates modern automation tools, cloud BI platforms, and next-gen AI skills—preparing learners for real industry roles in data analytics.
Progress through Statistics, DBMS, Excel, Google Sheets, SQL, BigQuery, BI tools (Power BI, Tableau, Looker), Power Automate, R and Python Programming—and finish with hands-on Predictive Modeling, Automation Workflows, and GenAI-based solutions.
 Hands-On Labs: 70% practical exercises using real datasets and industry tools Classroom Training: Interactive sessions with immediate instructor feedback Online Live Classes: Virtual training with screen-sharing and collaborative coding Hybrid Learning: Combine in-person and remote sessions seamlessly Self-Paced Practice: Access recorded sessions and datasets anytime Tool-Based Modules: Master Excel, Google Sheets, SQL, Big Query, Power BI, Tableau, Looker Studio, Python and R programming sequentially Project-Driven Learning: Apply skills through real case studies and capstone projects Industry Datasets: Work on finance, retail, and healthcare datasets for real insights Certification Preparation: Python and PowerBI Certification exam scenarios included Weekly Assessments: Quizzes and practical tests to track progress Statistics Foundation : Measure of central tendency, Measure of Spread, Correlation analysis, Practical implementation on datasets. Implementation of Inferential Statistics : Probability, distributions, hypothesis testing, ANOVA Advanced Spreadsheet & VBA : Advanced formulas & data cleaning, Pivot tables & automation, Macros & VBA scripting using Excel and Google Sheets. SQL Database Management and BigQuery : Queries, joins, stored procedures, DB design, partitioned tables, clustered tables Power BI Mastery : DAX functions, visualizations, publishing, AI features Tableau Visualization : Interactive dashboards, maps, and advanced charts Power Automate : Triggers and actions, reporting automation Looker Studio : Visualization using charts, tables and scorecards. R Programming : dplyr, tidyr, ggplot, r markdown Python for Analytics : Pandas, NumPy, visualization, ML basics Statistical Analysis: Descriptive & inferential stats, regression, correlation Spreadsheets: Microsoft Excel, Google Sheets (formulas, pivots, macros, VBA) Business Intelligence: Power BI, Tableau dashboards and Looker Studio Databases and Cloud: MySQL, SQL Server fundamentals, BigQuery Programming: R(tidyr, dplyr, ggplot), Python (Pandas, NumPy, Matplotlib, Seaborn) Additional Skills: Web scraping, automation, API integration Fresh graduates from any background seeking entry into high-growth analytics careers Professionals in finance, marketing, operations, or HR looking to leverage data analytics Business analysts & consultants strengthening their toolkit with Spreadsheets, DBMS, Programming & BI tools IT professionals and developers transitioning into data science or analytics roles Entrepreneurs analyzing customer behavior, sales patterns, and operational metrics Career changers from non-technical backgrounds seeking structured, placement-ready training Statistical Analysis Mastery: Apply descriptive & inferential statistics including probability, hypothesis testing, ANOVA, chi-square, and correlation analysis Advanced Excel & VBA Expertise: Create dashboards, automate tasks with macros, and master complex formulas for business reporting SQL & BigQuery Proficiency: Write advanced queries, design databases, and optimize performance for large datasets Business Intelligence Visualization: Build interactive dashboards in Power BI, Tableau & Looker with AI insights and DAX functions Python & R Data Analytics: Manipulate data using Pandas, dplyr, NumPy, perform automation, and create data visualizations & ML models End-to-End Analytics Projects: Execute workflows from data collection to visualization and actionable recommendations
Prerequisites: Basic knowledge of Excel and statistics is recommended. Interest in data analysis, business intelligence, and problem-solving will help you grasp advanced analytics efficiently.
Objective: Enable learners to clean, organize, analyze, and visualize data using Microsoft Excel and Google Sheets, while creating automated and collaborative dashboards. This combined approach helps learners work with live, cloud-based datasets and build business-ready reports commonly used in real corporate and analytics environments.
Objective: Help learners understand how to work with relational databases using SQL to fetch, update, and analyze structured data. This skill enables them to answer real business questions, manage large datasets efficiently, and support data-driven decision-making in practical work environments.
Objective: Help learners create clear and interactive dashboards using Power BI and Tableau to visualize data, highlight trends, and share insights effectively. This skill supports better decision-making by presenting data in a simple and meaningful way for both technical and non-technical audiences.
Objective: Build skills in Looker Studio to create real-time, interactive dashboards for marketing, performance, and web analytics. The course emphasizes clear data visualization to support informed decision-making across teams.
Objective: Learn how to work with large amounts of data using SQL in Google BigQuery. This course focuses on combining cloud data with dashboards and reports to support business and enterprise analytics needs.
Objective: Enable learners to automate reporting and data workflows with scheduled updates, alerts, and notifications. This approach helps streamline operations and improve efficiency in real business environments.
Objective: Build a strong foundation in essential statistical concepts to support data-driven decision-making. This helps learners correctly interpret data and validate insights using practical statistical methods.
Objective: Help learners build strong programming skills to clean, analyze, visualize, and automate data tasks. This enables them to work with complex datasets and create reusable scripts for real-world analytics.
Objective: Gain practical experience with statistical analysis and exploratory data analysis using R, focusing on data exploration, hypothesis testing, and clear interpretation of results for research and analytical modeling.
Objective: Help learners use AI tools to quickly analyze data, generate meaningful insights, and support predictive analysis and automated reporting. The focus is on practical use while understanding ethical considerations and the limitations of AI in real business scenarios.
Objective: Train learners to design effective prompts that generate accurate insights, create reports, and support analytics workflows using Generative AI tools.
Apply your skills through comprehensive projects including customer segmentation analysis, sales forecasting dashboards, financial risk assessment models, marketing campaign optimization, supply chain analytics, and predictive modeling using Python—all based on authentic business scenarios and datasets.
Skills You'll Gain: Dynamic reactive forms from JSON schemas Query builder and runtime reporting Data visualization with charts & grids Export pipelines (CSV, XLSX, PDF) Monorepo & modular deployment with NX Description:Make an analytics suite that can be changed so that admins can set up datasets and form schemas that…
Skills You'll Gain: CRUD operations for collections Schema design for flexible catalogs Indexing for search optimization Aggregation pipelines for analytics Data validation Description: For this project, students will make a MongoDB database that can grow to hold an e-commerce product catalog. They will make models of products with flexible schemas,…
Skills You'll Gain: Healthcare dataset modeling Cohort analysis for patients Hospital KPIs (readmission, LOS) Geographical heatmaps HIPAA-compliant reporting Description: This project shows students how to make a Patient Insights Dashboard for hospitals and clinics. Learners will look at patient demographics, keep track of readmission rates, and see how treatments work.…
Receive a globally valued certification that validates your skills, practical knowledge, and job-ready expertise. This certification enhances your credibility, strengthens your resume, and helps you stand out to employers in competitive industries worldwide.

Professionals Trained

Countries & Counting

Corporate Served







Build industry-ready skills with practical learning, expert guidance, real-world projects, and career-focused support. Our programs are designed to help you stay ahead of industry trends and confidently prepare for your professional journey.
Master a curriculum crafted and constantly updated by industry experts to match real-world trends, ensuring every concept and project builds job-ready, future-proof skills.
Receive one-on-one mentorship, resume reviews, mock interviews, and complete placement assistance through our 500+ hiring partners to accelerate your tech career.
Learn directly from certified professionals with years of hands-on experience who guide you through every module, project, and career milestone personally.
Gain practical exposure by working on live, industry-grade projects that mirror real business challenges, strengthening your technical execution and problem-solving abilities.
Join thousands of successful learners who have launched rewarding tech careers through Grras. Our consistent placement results, trusted partnerships, and alumni success stories speak for the quality of our training.
Navigate your professional journey with a comprehensive guide that transforms learning into opportunity. Discover proven strategies to build skills, gain experience, and secure your ideal position in today’s competitive job market.
 Building Strong Foundation
Focus on industry-relevant skills

Real-world projects to implement learned concepts.

Weekly tests to assess progress

 Sharpening Interview Readiness
Mock sessions with real-time feedback from experts

Host industry experts for advanced technical guidance

Focus on problem-solving, critical thinking, and domain expertise

 Communication & Aptitude Skill Development
Through interactive classes, students enhance both verbal and non-verbal communication, while also learning to present their ideas clearly, confidently, and effectively.

Enhances students' problem-solving, analytical thinking, and numerical ability-preparing them for competitive exams and placement tests.
 Resume building masterclasses
Help students structure professional, impactful resumes

 Bridging the Gap
* Partner with top companies for hiring pipelines * Conduct webinars and sessions with recruiters
* Connect candidates to aligned opportunities * Organize hiring events and recruitment drives
 Advance interview boot camp
Equip students to handle high-pressure interview situations
Prepare students for various interview formats, including case studies, coding rounds, and group discussions
 Personalized 1:1 guidance
* Address specific weaknesses and barriers to success. * Develop personalized improvement plans

Focus on industry-relevant skills
Real-world projects to implement learned concepts.
Weekly tests to assess progress
Mock sessions with real-time feedback from experts
Host industry experts for advanced technical guidance
Focus on problem-solving, critical thinking, and domain expertise
Through interactive classes, students enhance both verbal and non-verbal communication, while also learning to present their ideas clearly, confidently, and effectively.
Enhances students' problem-solving, analytical thinking, and numerical ability-preparing them for competitive exams and placement tests.
Help students structure professional, impactful resumes
* Partner with top companies for hiring pipelines * Conduct webinars and sessions with recruiters
* Connect candidates to aligned opportunities * Organize hiring events and recruitment drives
Equip students to handle high-pressure interview situations
Prepare students for various interview formats, including case studies, coding rounds, and group discussions
* Address specific weaknesses and barriers to success. * Develop personalized improvement plans

Our extensive network of hiring partners spans various industries, offering diverse opportunities to kickstart your career.










The GRRAS AI-Powered Data Analytics & Automation Master Program covers Excel, Google Sheets, SQL, BigQuery, Power BI, Tableau, Looker Studio, business statistics, Python and R. The curriculum also includes Power Automate, predictive insights and Generative AI for reporting workflows.
The course overview is designed for graduates, career changers and professionals in finance, marketing, operations or HR. Basic Excel and statistics knowledge is recommended. Discuss your background with GRRAS to confirm prerequisites for the current batch.
Yes, the published learning path includes spreadsheet, database and statistics foundations before programming and AI modules. Beginners should plan regular practice with datasets and assignments; ask the advisor about any preparatory learning needed.
GRRAS offers Jaipur classroom and live online learning options for this 6-month programme. The Jaipur centre is at 219, Himmat Nagar, Gopalpura Mod, Tonk Road, Jaipur, Rajasthan 302018. Confirm the current classroom timetable and online batch availability during counselling. View the Jaipur centre on Google Maps.
Course fees are shared during student counselling. Contact GRRAS for the current fee details and confirm instalments, applicable taxes, software licences and any external examination, AI API or cloud charges before enrolling.
The AI-Powered Data Analytics & Automation Master Program has a duration of 6 months. Confirm the weekly timetable, practice requirements and weekday or weekend batch availability during counselling.
The course includes a certification section and practical skill development. Ask GRRAS to confirm the issuing organisation, completion requirements and whether any external certification examination or fee is included. Course completion is not the same as passing a vendor certification exam.
Compare the actual syllabus, instructor experience, hands-on assignments, portfolio feedback, batch hours, class size, fees and career-support terms. Review the GRRAS syllabus and projects, then request a demo and current Jaipur batch details to judge whether the learning path suits your goals.
GRRAS provides 100% job assistance for this programme. Job assistance supports your job search; it is not a promise of guaranteed employment or a fixed salary. Ask during counselling for the current support process, eligibility requirements and terms. Final hiring decisions remain with employers.
Yes. The syllabus includes Excel and Google Sheets for formulas, data preparation, dashboards and automation, followed by SQL and database management. BigQuery adds cloud-based querying and integration with business intelligence tools.
The BI modules cover dashboards, visualisation and business reporting. Power BI topics include DAX and publishing, while Tableau covers interactive charts and dashboards. Looker Studio is also included for connected reports and scorecards.
Yes. Python topics include data cleaning and analysis with Pandas and NumPy, visualisation with Matplotlib and Seaborn, and introductory modelling. R programming is also included for data wrangling, statistical analysis and exploratory data analysis.
The AI modules cover prompt engineering, tools such as ChatGPT and Gemini, natural-language analytics and reporting support. Learners should check AI outputs against the underlying data, document limitations and avoid uploading confidential information to unapproved services.
The curriculum introduces triggers, actions and workflows for automating repetitive reporting tasks. Combine this with spreadsheet, SQL and BI skills to understand how data moves through a reporting process and how to check the accuracy of automated outputs.
The published curriculum includes sales reporting, SQL customer insights, Power BI dashboards, Looker Studio marketing reports, BigQuery analytics, Python visualisation and automated reporting. Case studies also cover customer segmentation, churn, finance and predictive insights. Confirm which briefs are assessed in your batch.
Document the business question, dataset source, cleaning steps, queries, dashboard and conclusions for each project. Include reproducible code or SQL, screenshots and a clear explanation of limitations. Use public or authorised sample data and explain your own contribution rather than presenting AI-generated work as unreviewed original analysis.
Relevant learning paths include data analyst, BI analyst, reporting analyst, marketing analyst and data visualisation roles. Hiring depends on demonstrated skills, experience and employer requirements. Ask GRRAS for current career-support services; training and certification do not guarantee a job, salary or placement.
Excel supports quick exploration and spreadsheet reporting, SQL retrieves and combines database records, and Python supports repeatable cleaning and analysis. Choose tools according to the dataset, reporting requirements and maintainability rather than treating one tool as a replacement for every other tool.
Joins connect related tables such as customers, orders and products. Analysts should check join keys, duplicate records and unmatched rows so that totals and business metrics are not accidentally inflated or omitted.
Exploratory data analysis examines a dataset before drawing conclusions. It involves checking structure, missing values, distributions, unusual observations and relationships, then summarising findings with appropriate tables and charts.
First investigate why values are missing and whether repeated records are genuine duplicates. Document any removal, replacement or aggregation, and compare results before and after cleaning. The appropriate treatment depends on the business question and the meaning of the data.
Start with averages, medians, variation, distributions and sampling. Then study probability, confidence intervals and hypothesis testing. The GRRAS curriculum includes descriptive and inferential statistics alongside practical interpretation of datasets.
No. Correlation describes an association, not proof of causation. Other factors, sampling effects or reverse relationships may explain the pattern. State this limitation when presenting an analysis or business recommendation.
BigQuery is useful for querying larger cloud-based datasets with SQL and connecting results to reporting tools. A spreadsheet may be more convenient for smaller ad hoc tasks. Consider data size, access controls and query costs before choosing the platform.
Keep the source information, cleaning decisions, queries or scripts and software requirements together. Document assumptions, avoid manual steps that cannot be repeated, and check that another person can reproduce the same key results from authorised data.
A useful dashboard answers a specific business question, presents clearly defined metrics and helps its audience take informed action. Include a relevant date range, clear labels and data-refresh information instead of adding charts only for decoration.
These are business intelligence and visualisation tools with different connectors, modelling features and sharing arrangements. The programme introduces all three; select a tool according to the organisation’s data environment, reporting needs and licensing requirements.
DAX is used to define calculations such as measures in a Power BI data model. Accurate results depend on the model, relationships and filter context, so calculations should be checked against known examples and source totals.
A well-structured model connects tables consistently and makes metrics easier to maintain. Check relationships, granularity and date handling so that filters and aggregations produce the intended result.
Choose the chart according to the comparison: bars for categories, lines for time trends and scatter plots for relationships. Use clear units and readable scales, and avoid a visual that exaggerates differences or hides important context.
Document what each KPI measures, its calculation, time period, exclusions and data source. Agree on definitions with stakeholders so that a label such as revenue or active customer means the same thing across reports.
Compare totals with the source, test filters and date ranges, check null values and review the dashboard with its intended audience. Verify who can access the underlying data before publishing or sharing a report.
Explain the audience, business question, dataset, cleaning and model decisions, dashboard design and findings. Include screenshots or an authorised demo and describe limitations. Use public or permissioned data rather than exposing private organisational records.
No. AI can help draft queries or explain concepts, but analysts still need to understand the data, validate calculations and judge whether conclusions are justified. Review and test generated work before relying on it.
Specify the business question, relevant field definitions, expected output and constraints. Ask the tool to identify assumptions and uncertainty. Use only authorised information and validate the answer against the underlying data.
Trace each important statement to the dataset or calculation, check totals and units, and test suspicious patterns independently. Separate observed facts from predictions or suggestions and clearly describe remaining uncertainty.
Do not upload confidential or personal data to an unapproved service. Follow the organisation’s policies, minimise the information shared and use public, synthetic or properly authorised sample data for practice.
Workflow automation executes defined steps such as refreshing a report or sending an alert. AI may generate text, classify information or suggest insights. Combining them still requires validation, access controls and a plan for handling errors.
Add input checks, logging, error alerts and a way to review failed runs. Reconcile important totals, monitor refresh times and document ownership so that an automated report does not silently deliver stale or incorrect information.
Describe the dataset, assumptions, evaluation approach and situations where the model may fail. Avoid presenting a forecast as a certainty, and explain that performance on past data does not guarantee future results.
Some tools may have licensing, usage or API charges. Ask GRRAS which accounts, licences and credits are included in the current batch and which costs are separate. Never assume that a course fee includes unlimited third-party usage.
The GRRAS AI-Powered Data Analytics & Automation Master Program covers Excel, Google Sheets, SQL, BigQuery, Power BI, Tableau, Looker Studio, business statistics, Python and R. The curriculum also includes Power Automate, predictive insights and Generative AI for reporting workflows.
The course overview is designed for graduates, career changers and professionals in finance, marketing, operations or HR. Basic Excel and statistics knowledge is recommended. Discuss your background with GRRAS to confirm prerequisites for the current batch.
Yes, the published learning path includes spreadsheet, database and statistics foundations before programming and AI modules. Beginners should plan regular practice with datasets and assignments; ask the advisor about any preparatory learning needed.
GRRAS offers Jaipur classroom and live online learning options for this 6-month programme. The Jaipur centre is at 219, Himmat Nagar, Gopalpura Mod, Tonk Road, Jaipur, Rajasthan 302018. Confirm the current classroom timetable and online batch availability during counselling. View the Jaipur centre on Google Maps.
Course fees are shared during student counselling. Contact GRRAS for the current fee details and confirm instalments, applicable taxes, software licences and any external examination, AI API or cloud charges before enrolling.
The AI-Powered Data Analytics & Automation Master Program has a duration of 6 months. Confirm the weekly timetable, practice requirements and weekday or weekend batch availability during counselling.
The course includes a certification section and practical skill development. Ask GRRAS to confirm the issuing organisation, completion requirements and whether any external certification examination or fee is included. Course completion is not the same as passing a vendor certification exam.
Compare the actual syllabus, instructor experience, hands-on assignments, portfolio feedback, batch hours, class size, fees and career-support terms. Review the GRRAS syllabus and projects, then request a demo and current Jaipur batch details to judge whether the learning path suits your goals.
GRRAS provides 100% job assistance for this programme. Job assistance supports your job search; it is not a promise of guaranteed employment or a fixed salary. Ask during counselling for the current support process, eligibility requirements and terms. Final hiring decisions remain with employers.
Yes. The syllabus includes Excel and Google Sheets for formulas, data preparation, dashboards and automation, followed by SQL and database management. BigQuery adds cloud-based querying and integration with business intelligence tools.
The BI modules cover dashboards, visualisation and business reporting. Power BI topics include DAX and publishing, while Tableau covers interactive charts and dashboards. Looker Studio is also included for connected reports and scorecards.
Yes. Python topics include data cleaning and analysis with Pandas and NumPy, visualisation with Matplotlib and Seaborn, and introductory modelling. R programming is also included for data wrangling, statistical analysis and exploratory data analysis.
The AI modules cover prompt engineering, tools such as ChatGPT and Gemini, natural-language analytics and reporting support. Learners should check AI outputs against the underlying data, document limitations and avoid uploading confidential information to unapproved services.
The curriculum introduces triggers, actions and workflows for automating repetitive reporting tasks. Combine this with spreadsheet, SQL and BI skills to understand how data moves through a reporting process and how to check the accuracy of automated outputs.
The published curriculum includes sales reporting, SQL customer insights, Power BI dashboards, Looker Studio marketing reports, BigQuery analytics, Python visualisation and automated reporting. Case studies also cover customer segmentation, churn, finance and predictive insights. Confirm which briefs are assessed in your batch.
Document the business question, dataset source, cleaning steps, queries, dashboard and conclusions for each project. Include reproducible code or SQL, screenshots and a clear explanation of limitations. Use public or authorised sample data and explain your own contribution rather than presenting AI-generated work as unreviewed original analysis.
Relevant learning paths include data analyst, BI analyst, reporting analyst, marketing analyst and data visualisation roles. Hiring depends on demonstrated skills, experience and employer requirements. Ask GRRAS for current career-support services; training and certification do not guarantee a job, salary or placement.
Excel supports quick exploration and spreadsheet reporting, SQL retrieves and combines database records, and Python supports repeatable cleaning and analysis. Choose tools according to the dataset, reporting requirements and maintainability rather than treating one tool as a replacement for every other tool.
Joins connect related tables such as customers, orders and products. Analysts should check join keys, duplicate records and unmatched rows so that totals and business metrics are not accidentally inflated or omitted.
Exploratory data analysis examines a dataset before drawing conclusions. It involves checking structure, missing values, distributions, unusual observations and relationships, then summarising findings with appropriate tables and charts.
First investigate why values are missing and whether repeated records are genuine duplicates. Document any removal, replacement or aggregation, and compare results before and after cleaning. The appropriate treatment depends on the business question and the meaning of the data.
Start with averages, medians, variation, distributions and sampling. Then study probability, confidence intervals and hypothesis testing. The GRRAS curriculum includes descriptive and inferential statistics alongside practical interpretation of datasets.
No. Correlation describes an association, not proof of causation. Other factors, sampling effects or reverse relationships may explain the pattern. State this limitation when presenting an analysis or business recommendation.
BigQuery is useful for querying larger cloud-based datasets with SQL and connecting results to reporting tools. A spreadsheet may be more convenient for smaller ad hoc tasks. Consider data size, access controls and query costs before choosing the platform.
Keep the source information, cleaning decisions, queries or scripts and software requirements together. Document assumptions, avoid manual steps that cannot be repeated, and check that another person can reproduce the same key results from authorised data.
A useful dashboard answers a specific business question, presents clearly defined metrics and helps its audience take informed action. Include a relevant date range, clear labels and data-refresh information instead of adding charts only for decoration.
These are business intelligence and visualisation tools with different connectors, modelling features and sharing arrangements. The programme introduces all three; select a tool according to the organisation’s data environment, reporting needs and licensing requirements.
DAX is used to define calculations such as measures in a Power BI data model. Accurate results depend on the model, relationships and filter context, so calculations should be checked against known examples and source totals.
A well-structured model connects tables consistently and makes metrics easier to maintain. Check relationships, granularity and date handling so that filters and aggregations produce the intended result.
Choose the chart according to the comparison: bars for categories, lines for time trends and scatter plots for relationships. Use clear units and readable scales, and avoid a visual that exaggerates differences or hides important context.
Document what each KPI measures, its calculation, time period, exclusions and data source. Agree on definitions with stakeholders so that a label such as revenue or active customer means the same thing across reports.
Compare totals with the source, test filters and date ranges, check null values and review the dashboard with its intended audience. Verify who can access the underlying data before publishing or sharing a report.
Explain the audience, business question, dataset, cleaning and model decisions, dashboard design and findings. Include screenshots or an authorised demo and describe limitations. Use public or permissioned data rather than exposing private organisational records.
No. AI can help draft queries or explain concepts, but analysts still need to understand the data, validate calculations and judge whether conclusions are justified. Review and test generated work before relying on it.
Specify the business question, relevant field definitions, expected output and constraints. Ask the tool to identify assumptions and uncertainty. Use only authorised information and validate the answer against the underlying data.
Trace each important statement to the dataset or calculation, check totals and units, and test suspicious patterns independently. Separate observed facts from predictions or suggestions and clearly describe remaining uncertainty.
Do not upload confidential or personal data to an unapproved service. Follow the organisation’s policies, minimise the information shared and use public, synthetic or properly authorised sample data for practice.
Workflow automation executes defined steps such as refreshing a report or sending an alert. AI may generate text, classify information or suggest insights. Combining them still requires validation, access controls and a plan for handling errors.
Add input checks, logging, error alerts and a way to review failed runs. Reconcile important totals, monitor refresh times and document ownership so that an automated report does not silently deliver stale or incorrect information.
Describe the dataset, assumptions, evaluation approach and situations where the model may fail. Avoid presenting a forecast as a certainty, and explain that performance on past data does not guarantee future results.
Some tools may have licensing, usage or API charges. Ask GRRAS which accounts, licences and credits are included in the current batch and which costs are separate. Never assume that a course fee includes unlimited third-party usage.



Copyright © 2026 GRRAS Solutions Pvt. Ltd.


 Whatsapp us
 Call us
 Enquire Now